In our previous post, we talked about the importance of a sales funnel analysis. This time, we will get into a sales pipeline analysis—and how to effectively implement it into your existing work systems.
How are these two different?
First of all: a sales pipeline is the list or sequence of steps a salesperson takes in the selling process. It can look like this:
Step 1: Prospecting
Step 2: Qualifying Leads
Step 3: Initial Meeting / Presentation
Step 4: Proposal Submission
Step 5: Negotiation
Step 6: Closing the Deal
Step 7: Customer Retention
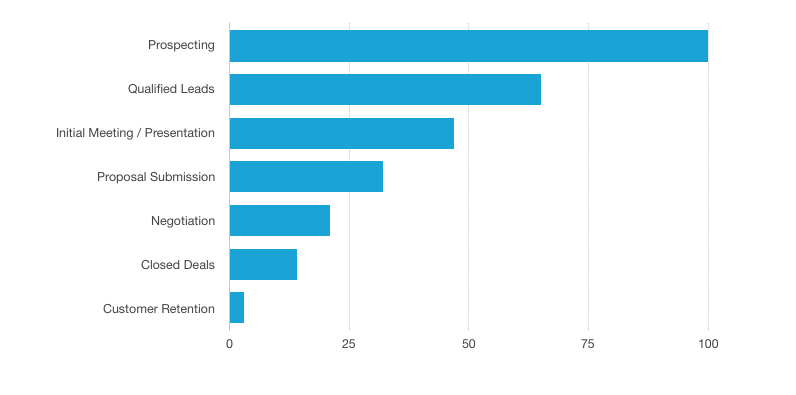
The sales funnel analysis shows the quantity and conversion of prospects between each stage or step of the buyer’s journey—or your pipeline stages (as mentioned above). It can look like this:
What is a Sales Pipeline Analysis?
Now, the sales pipeline analysis examines how a prospect moves through the pipeline stages—whether they move to the next stage or drop off at a certain one. You can say that it’s a more detailed analysis of what’s really happening in the pipeline.
It looks at the data and the movements of prospects at each pipeline stage and scrutinizes everything the sales representatives are doing at each step to determine where they’re successful and where they’re not.
This sales pipeline analysis is conducted using key metrics and reports that you employ and monitor with the help of a CRM.
What Key Metrics Should You Have in Your Sales Pipeline Analysis?
Use these metrics to check how healthy your pipeline is:
Sales Pipeline Coverage / Number of Deals in the Pipeline
Sales Pipeline Coverage (SPC) tracks the frequency and number of leads added to the pipeline. You will be able to see if the existing number and frequency will help you meet your targets. Tracking your SPC also helps determine your lead conversion rate later on in the process. To calculate for SPC, you can divide the total pipeline coverage in a given time period by the sales quota for that same period. So if your quota is $100,000 and your pipeline so far is $200,000, your SPC is double.
However, it’s best to have at least an SPC of 5, meaning: in the above example, your SPC should at least be $500,000.
Total Pipeline Value
Add up the values of all the deals in the pipeline to get the Total Pipeline Value.
Average Deal Size
Divide the Total Pipeline Value by the number of deals in the pipeline to get the Average Deal Size.
Days to Close / Sales Velocity
How many days or weeks did it take to move from prospecting to closing? This is the average time leads stay in the pipeline before they are won.
Win Rate
Divide your number of wins by the total number of prospects or leads. So if you won 5 deals out of a total of 20, your win rate is 25%.
Sales Pipeline Velocity
The velocity formula uses these 4 attributes:
- The number of active qualified opportunities
- The monthly average closed deal value
- Monthly deal win rate percentage
- The average length of sales cycle as a % of a 12 month period
The Sales Pipeline Velocity formula is: No. of Active Opportunities x Monthly Average Closed Deal Value x Monthly Deal Win Rate Percentage / Average Length of Sales Cycle (as a % of a 12 month period)
So if you want to improve your sales pipeline velocity, you have to work on improving those 4 attributes.
Use these metrics to check on the quality of the work output of your sales representatives:
Sales Activity and Efficiency
You need to track your team’s daily activities. Usual activities include: calls, emails, conversations / interactions, appointments scheduled, sales presentations, proposals sent, leads sourced, and so on. But it’s not enough to just track the number of sales activities, you also have to see the efficiency rate. They may be doing all the activities as mandated, but not getting anywhere.
The simple ratio is “activity:results”—so this can be number of calls to number of connects; number of meetings scheduled to number of opportunities; number of opportunities to number of deals; and so on.
Time Spent Selling
Part of tracking sales activities is tracking the time spent selling—because time is very valuable in sales. Automation can help with certain tasks and improve efficiency.
Lead Response Time
How quickly do you respond to a lead? Normal business protocol requires that you reply within one business day, but in sales, the quicker you act on an inquiry, the better your chances of closing the deal.
Sales Per Rep / Individual Sales Rep Performance
This metric measures the success (or failure) of each sales representative on your team. Of course, not all sales reps are at the same level. For this you have to establish your baseline. Once that baseline has been established and you notice a consistent dip in performance throughout the team, you may need to review the strategies in place.
If some sales reps are doing better, then that’s your cue to mentor or coach those that are lagging behind. This is why it’s important to consistently measure this at this stage—so you can address the weak points immediately.
So you can extract actionable insights from your sales pipeline analysis, you need to establish key metrics for performance and processes in every pipeline stage and constantly evaluate the ensuing reports. A powerful CRM is a must for utmost efficiency, and so is the commitment to investing your time in analyzing every data.

Main photo by Campaign Creators on Unsplash